To begin with, I suggest defining the terminology. We understand this term as a set of software tools and business processes. Therefore, end-to-end Analytics can't be represented by a single service, it can only be one of the components. For the next publication, I will review the features of the most popular services.
To understand what end-to-end Analytics is, let's look at it in General terms. If it is quite simple, it is a combination of data about customer interactions with the company. Interactions are divided into two types: online and offline.

Online
- Website, mobile application (Google Analytics, social. network)
- Advertising system (Google AdWords, Yandex.Direct, etc.)
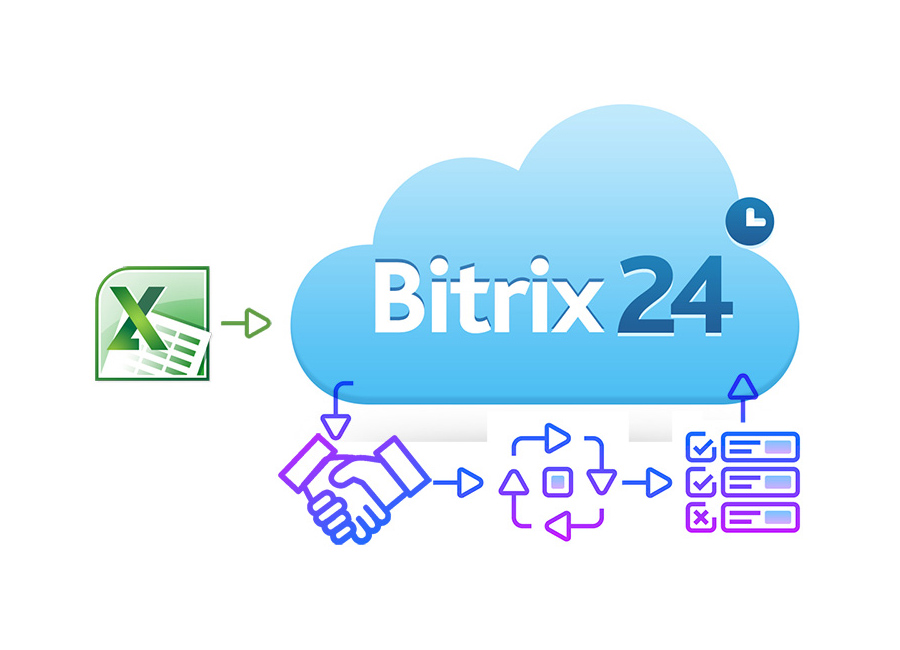
- Online messenger (Jivosite, Bitrix24, etc.)
- Calltracking (Calltouch, Comagic, etc.)
- Callbacks from the site (Callbackhunter, etc.)
- Third-party services (AppStore, GooglePlay, etc.)
- Promotion expenses (SEO, copywriting, etc.)
Offline
- Marketing (promotions, campaigns, distribution and spending on them)
- ERP (1C, internal costs)
- PBX (Mango, Asterisk, etc.)
- CRM (1C, Bitrix24, AmoCRM, etc.)
- Indirect expenses (hosting, wages, etc.)
As you can see, each type is responsible for its own system, some of them have regular integration capabilities, but there is a natural question:
Where do I combine all this data?
First, it is too expensive to combine all the systems at once, and second, the choice of system depends on your business and the tasks that you set for end-to-end Analytics. So for a small online store, Google Analytics and Google Sheets will be enough, while for a large business, Google Big Query, IBM Watson or MS Power Bi will be more suitable. Each of these systems has its own characteristics. We will provide a more detailed overview of their main features in the following posts.
Let's figure out which questions can be answered using end-to-end Analytics, and where to get such questions. First, you should analyze the main KPIs of your business. The main questions will be about what affects them. If you have a marketer or business analyst on your staff, they will constantly send you questions that can be answered by such tools. Any abnormal spikes or drops in a particular indicator are often a reason for detailed study, because this can signal not only failures, but also opportunities for your business.
Based on this, we can determine which systems require integration, and, therefore, which tool is better to use.
It is also important to consider the main data requirements for each component of the Analytics system:
- Up-to-date (regular data updates)
- Connectivity (each new data portion must have at least one common field that can be used to link it to other data)
- Integrity (each upload for a specific period must contain all available data)
How does data merge work?
A link is formed for each service and the frequency of data exchange is set. Most services have an API that allows you to get the necessary data, or upload it in one of the standard formats (XML, CSV). In some cases, to integrate with the PBX, you need to develop an application that generates an exchange file. A similar mechanism has to be developed for sending other ”internal" company data.
Who should do the analysis itself, and how does it work? It all depends on which service you plan to link data to. If we are talking about Google Analytics, then you can solve your problems with the help of a certified specialist, and if we are talking about other services, these tasks can be solved by a team of full-time specialists, or contact companies that specialize in implementation and Analytics services.
Since data Analytics is a fairly new field, the requirements for an analyst are quite high. Often the list of basic requirements looks something like this: Higher education in Economics/Finance, statistics or information technology. Knowledge of market analysis methods, basic statistics, analytical skills, and skills to work with large amounts of information. Basic knowledge of SQL and programming (for example, Python).
But I should note that for some companies, several individual reports may be sufficient, for example, for each division, which can be generated automatically with a specified frequency.
The analysis process itself is based on the following scheme:
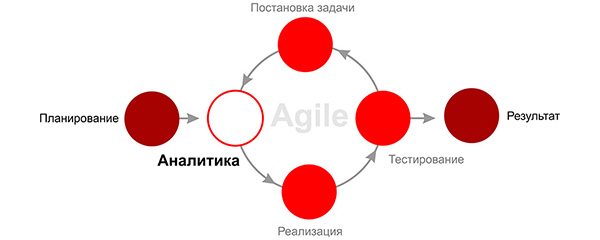
Working on data is based on the Agile paradigm. Each cycle can take several days or a month, depending on the needs of your company. For example, if you are planning a one-month marketing campaign, it is best to work with weekly cycles. During this period, enough data will accumulate for analysis, and you will have time to optimize your campaign.
In addition to reports, you can use end-to-end Analytics to fully calculate such indicators as ROI (for each campaign or as a whole), DROI ( for marketing actions that do not have a direct impact, but affect only indirectly), LTV (total sales over the customer's lifecycle), RLTV (profit received from a specific customer) and other important business indicators.

Who needs it?
So we see that end-to-end Analytics is not suitable for all companies. The main conditions under which end-to-end Analytics can be implemented:
- Advanced and modern approach to solving the business problem of the company's top management
- Infrastructure for data collection and storage
- The presence of formalized or automated business processes in the company
How much does it cost?
As you have already understood, building an Analytics system is not only one-time actions for integrating various services (which we recommend taking turns at short intervals), but also the constant work of an analyst or a team consisting of analysts and a developer.
The cost of each integration ranges from 30,000 to 100,000 rubles, and the total can reach up to 500,000 rubles. Third-party Analytics and ongoing service development services can range from 50,000 to 200,000 per month.
Naturally, each case is individual and requires a separate assessment and planning of work.
What is the real effectiveness of implementing such systems?
Analytics does not make a profit directly, but it allows you to optimize most of the expense items that affect sales, and only slightly by increasing sales. If we talk about specific figures, the average cost optimization is about 15%, and the increase in revenue is about 5%. in Other words, the introduction of end-to-end Analytics will be effective with a monthly profit of more than 500 thousand rubles.
In the continuation of this article, we will analyze the features and features of several “end-to-end Analytics” services: Colibo, Origami, CoMagic, Roistat.